

High Voltage Changer Evaluation: Key Methods for Accurate Assessments
2026-08-07
When assessing high voltage changers, precision isn't just an advantage—it's a necessity. From industrial power systems to advanced electrical grids, accurate evaluation methods can mean the difference between seamless operation and costly downtime. Enter Chang Song, a name synonymous with reliability in high-stakes testing. But what truly sets an exceptional evaluation apart? Let's peel back the layers of methodology and uncover the key techniques that ensure your assessments are not just good, but impeccable.
Rethinking Insulation Resistance: Beyond the Standard Megger Routine
For decades, the insulation resistance test has been a staple of electrical maintenance, typically performed with a handheld megger at a single voltage for a few seconds. The pass/fail mindset often reduces this critical diagnostic to a simple number, but that number rarely tells the whole story. Temperature, humidity, and the age of the insulation can skew results, making a “good” reading today a prelude to failure tomorrow if underlying trends are ignored. It’s time to move past the checkbox routine and treat insulation resistance as a dynamic health indicator rather than a static pass/fail gate.
Advanced diagnostic techniques like the polarization index (PI) and dielectric absorption ratio (DAR) elevate the standard test from a snapshot to a meaningful trend analysis. Instead of relying on a single 60-second reading, taking measurements at multiple time intervals reveals how the insulation behaves under sustained electrical stress. A low PI value, for instance, often points to moisture ingress or contamination long before leakage current becomes critical. Complementing these timed tests with step voltage or ramp tests can unmask weaknesses that a fixed-voltage megger test would miss entirely, providing a far richer picture of asset condition.
True reliability lies in understanding what the numbers are whispering, not just when they shout failure. Integrating data from dissolved gas analysis, partial discharge monitoring, and thermal imaging with insulation resistance trends builds a comprehensive insulation health profile. By logging and trending these values over time, you shift from reactive replacement to predictive intervention—catching degradation when it’s still manageable. Rethinking insulation resistance means embracing it not as a routine obligation but as a continuous conversation with your electrical assets, one that yields early warnings and smarter maintenance decisions.
Sweep Frequency Response: How Winding Shifts Reveal Damage
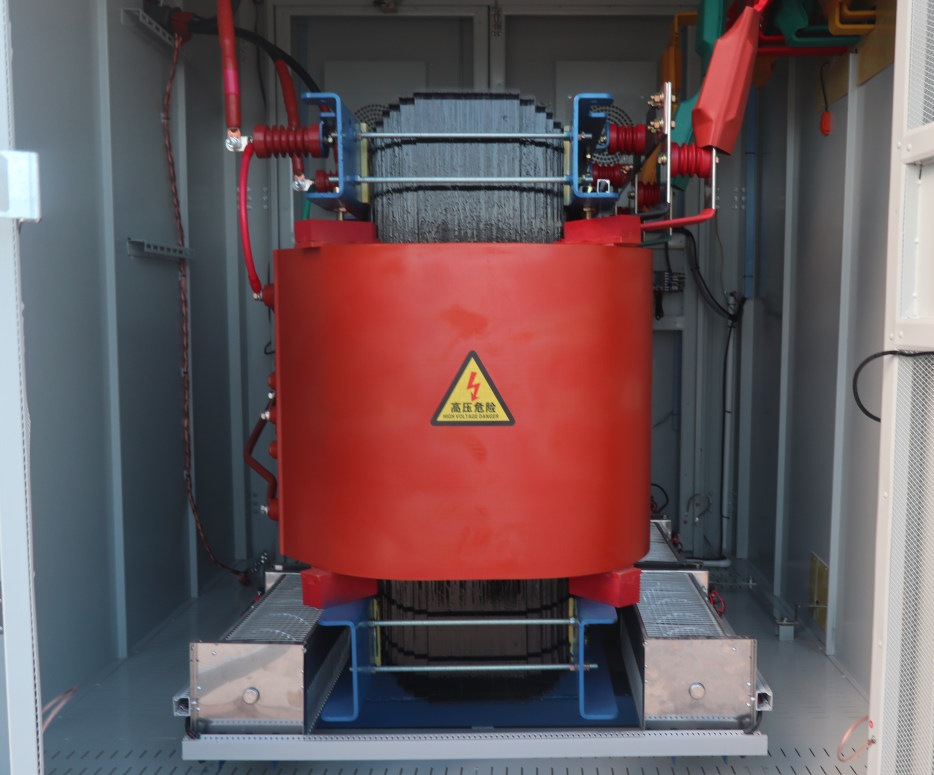
Transformer windings are designed to hold their shape under immense electrical and mechanical stress, but age, faults, and through-faults can slowly nudge them out of position. Even millimeter-scale movements change the winding's impedance profile at high frequencies, creating a unique electrical fingerprint. Sweep frequency response analysis (SFRA) captures this fingerprint by injecting a low-voltage signal across a range of frequencies and measuring the response. The resulting trace is compared against a baseline—usually the factory test or a previous measurement—to spot deviations. A shift in a resonant peak or the appearance of a new trough isn't just a measurement artifact; it often signals that a winding has moved, loosened, or deformed.
What makes SFRA particularly insightful is its ability to discriminate between types of damage without opening the transformer. Axial displacement, radial buckling, and hoop stress distortion all produce distinct patterns on the frequency response curve. For example, a winding that has compressed along its axis might show a clear shift in the mid-frequency band, while a coil-to-coil short could create a sharp resonance that vanishes after the fault clears. The test itself is non-intrusive and surprisingly quick, yet interpreting the results demands a trained eye—it's as much art as science. Small changes that look alarming on a plot might be harmless manufacturing variances, whereas a gentle, broad shift could be the early whisper of a catastrophic failure.
Maintenance teams today often integrate SFRA with other diagnostic tools like dissolved gas analysis or capacitance measurements to build a fuller picture. Because the method is so sensitive to mechanical changes, it acts as an early warning system for problems that electrical tests might miss until it's too late. By tracking how winding resonances drift over time, utilities can move from reactive repairs to proactive planning—pulling a transformer out of service before a minor shift becomes a major rebuild.
Dissolved Gas Analysis as Live Intelligence, Not Just Periodic Data
Traditional dissolved gas analysis has long been confined to periodic lab reports, offering a snapshot of transformer health that’s already weeks old. But when you shift perspective and treat DGA data as a continuous stream of live intelligence, the entire maintenance paradigm transforms. Instead of waiting for a scheduled sample, you’re monitoring subtle gas trends as they emerge, catching thermal faults or partial discharge at inception rather than after damage compounds. This real-time awareness turns a once-static dataset into a dynamic tool that empowers operators to make informed decisions in the moment.
The difference is more than just speed—it’s about context. With online DGA sensors feeding a steady flow of readings, you can correlate minor gas fluctuations with load changes, ambient conditions, or switching events. A slight uptick in hydrogen stops being an isolated alarm and becomes part of a broader narrative: maybe it spikes only during peak load, or drifts upward during cooler weather when moisture ingress is more likely. That kind of layered understanding simply isn’t possible with quarterly lab samples. Live DGA gives you the power to discern whether a trend is benign or urgent, reducing both unnecessary outages and the risk of overlooking a genuine problem.
Ultimately, treating dissolved gas analysis as live intelligence means breaking free from the calendar-driven maintenance mindset. You no longer plan interventions around arbitrary dates; instead, you let the transformer’s own chemistry guide the schedule. This shift unlocks a proactive model where small anomalies can be investigated remotely, diagnostics can be refined with each new data point, and resources are directed where they matter most. The result is not just a healthier fleet, but a smarter, leaner operation that respects both the physics of the asset and the practicalities of the grid.
Thermal Imaging That Cuts Through the Noise
Clear thermal images aren't just about resolution—they're about signal clarity. Our sensors use advanced noise reduction algorithms that distinguish true heat signatures from background interference, delivering crisp visuals even in complex industrial environments.
By isolating thermal data at the pixel level, the system filters out reflections, atmospheric scatter, and electromagnetic noise that typically degrade image quality. This means operators see only what matters: precise temperature gradients, subtle hotspots, and accurate component-level detail.
The result is a imaging experience where false alarms drop dramatically and decision-making speed increases. You get the reliable thermal intelligence needed for predictive maintenance, process monitoring, and safety inspections—without second-guessing what's signal or noise.
Partial Discharge Monitoring Made Actionable
Partial discharge (PD) monitoring often drowns teams in raw data, making it hard to separate harmless noise from real threats. By focusing on actionable insights, we shift from tracking every blip to highlighting only the signals that matter—those linked to insulation degradation, tracking, or arcing. This approach cuts through the clutter, letting asset managers know exactly when and where to intervene, before a minor defect becomes a costly failure.
Modern systems distill continuous PD data into clear risk scores and trend alerts, so you’re not left interpreting phase-resolved patterns at 2 a.m. Instead of generic alarms, you get prescriptive guidance: which asset, what type of defect, and how urgently it needs attention. This transforms monitoring from a passive log into an active maintenance tool that aligns with your team’s workflows and outage planning.
The real value emerges when PD data connects to asset health indices and operational context—load, temperature, humidity—to filter out false positives. It means your crew acts only on validated risks, avoiding unnecessary shutdowns while staying ahead of developing faults. Ultimately, actionable PD monitoring means confidence in your decisions, longer asset life, and a leaner, more reliable grid.
Load Tap Changer Diagnostics: Where Traditional Tests Fall Short
When a transformer is pulled from service for routine testing, the load tap changer is often evaluated through static resistance measurements and timing checks. These methods provide a snapshot under no-load or low-voltage conditions, completely divorced from the thermal and mechanical stresses of real operation. As a result, subtle degradation like coking of contacts or weakening of springs can remain hidden until it manifests as a field failure.
Another blind spot of conventional diagnostics is their inability to capture transient behaviors. Arcing during tap transitions, momentary contact bounce, or brief mechanical hesitations are rarely seen when applying slow, manual stepping during an outage. These fleeting events often hold the earliest clues of impending trouble, yet they slip through the cracks of scheduled maintenance protocols designed decades ago.
Perhaps the most critical shortfall is the lack of condition monitoring under load. Without online observations of vibration patterns, temperature differentials, and dynamic resistance during actual current switching, operators are forced to rely on indirect indicators like oil dissolved gas analysis. This reactive posture delays interventions until damage is already done, undermining the very reliability the tap changer is meant to ensure.
FAQ
The main objective is to verify that the changer operates reliably under rated and fault conditions, ensuring power system stability and personnel safety.
Common tests include dielectric withstand tests, partial discharge measurements, and insulation resistance checks, often performed at elevated voltages to simulate real stress.
They help identify hotspots and abnormal heat patterns that may indicate loose connections, overloading, or internal degradation before catastrophic failure occurs.
Dynamic testing evaluates the tap changer's performance during actual operation, measuring transition timing, contact wear, and voltage fluctuations to catch mechanical issues early.
Consistently low contact resistance ensures efficient current transfer; any increase can lead to overheating and energy loss, signaling potential contact deterioration or misalignment.
Analyzing dissolved gases and furanic compounds in insulating oil reveals early signs of arcing, thermal faults, or cellulose degradation, often invisible through electrical tests alone.
Vibration analysis, motor current signature analysis, and acoustic monitoring can detect worn gears, bearing defects, or spring fatigue without disassembly.
By identifying and addressing minor issues before they escalate, routine evaluations prevent unplanned outages, reduce repair costs, and optimize maintenance schedules, ultimately prolonging the asset's service life.
Conclusion
As grid demands intensify, the way we assess high voltage changers must move beyond routine checklists. Rethinking insulation resistance means interpreting trends over time rather than treating a one-time megger reading as definitive. When combined with sweep frequency response analysis, subtle winding displacements or core shifts become detectable long before they escalate into failure. Similarly, dissolved gas analysis has evolved from a periodic lab test into a form of live intelligence, where continuous monitoring flags developing faults like overheating or arcing in real time. Together, these approaches shift the diagnostic mindset from reactive replacement to predictive insight.
Modern evaluation also depends on technologies that cut through operational noise. Thermal imaging, when calibrated and analyzed correctly, can pinpoint hotspots masked by ambient conditions or load variations, offering a visual map of trouble areas. Partial discharge monitoring has become genuinely actionable, with sensors and software that isolate signals from interference and deliver clear severity assessments. For load tap changer diagnostics, traditional timing and resistance tests often miss mechanical wear and contact degradation that advanced vibration or dynamic resistance measurements can catch. Integrating these methods ensures that every aspect of a high voltage changer’s health is understood, enabling targeted maintenance and avoiding unexpected outages.
Contact Us
Contact Person: Tonglun Chen
Email: [email protected]
Tel/WhatsApp: 8618906642555
Website: https://www.cncsele.com